Open Data Engagement Fund project on visualising road accidents - Blog Post by Cyril Connolly
28 May 2019My decision to submit a proposal to the Open Data Engagement Fund of visualising road traffic accidents in Dublin City came about because of my previous experience working in road accident research while employed in the National Roads Authority (NRA). The NRA later became Transport Infrastructure Ireland (TII), while the Road Accident Bureau, then part of the NRA with responsibility for recording all traffic accidents in Ireland, was transferred to Road Safety Authority (RSA). During the mid 1990s I worked on a project involving the identification of locations reporting high accidents in the Dublin City Council (DCC) area. This work was based on four years of accident data using DataDesk - an advanced exploratory data analysis and exploration application. Fast forward to 2019 and my decision to revisit this work. I was now able to obtain 26 years of road accident data and using a suite of software tools I set about mapping and visualising this data. For example, the open software R with its wide range of visualisation libraries like Leaflet and Shiny allowed me to create maps of accident locations or using relatively recent proprietary software like Tableau allowed for the creation of density plots in the form of hot spots of accidents locations. See, for example Figure 1 (left) for pedestrian accidents and Figure 1 (right) for cyclist accidents in DCC.
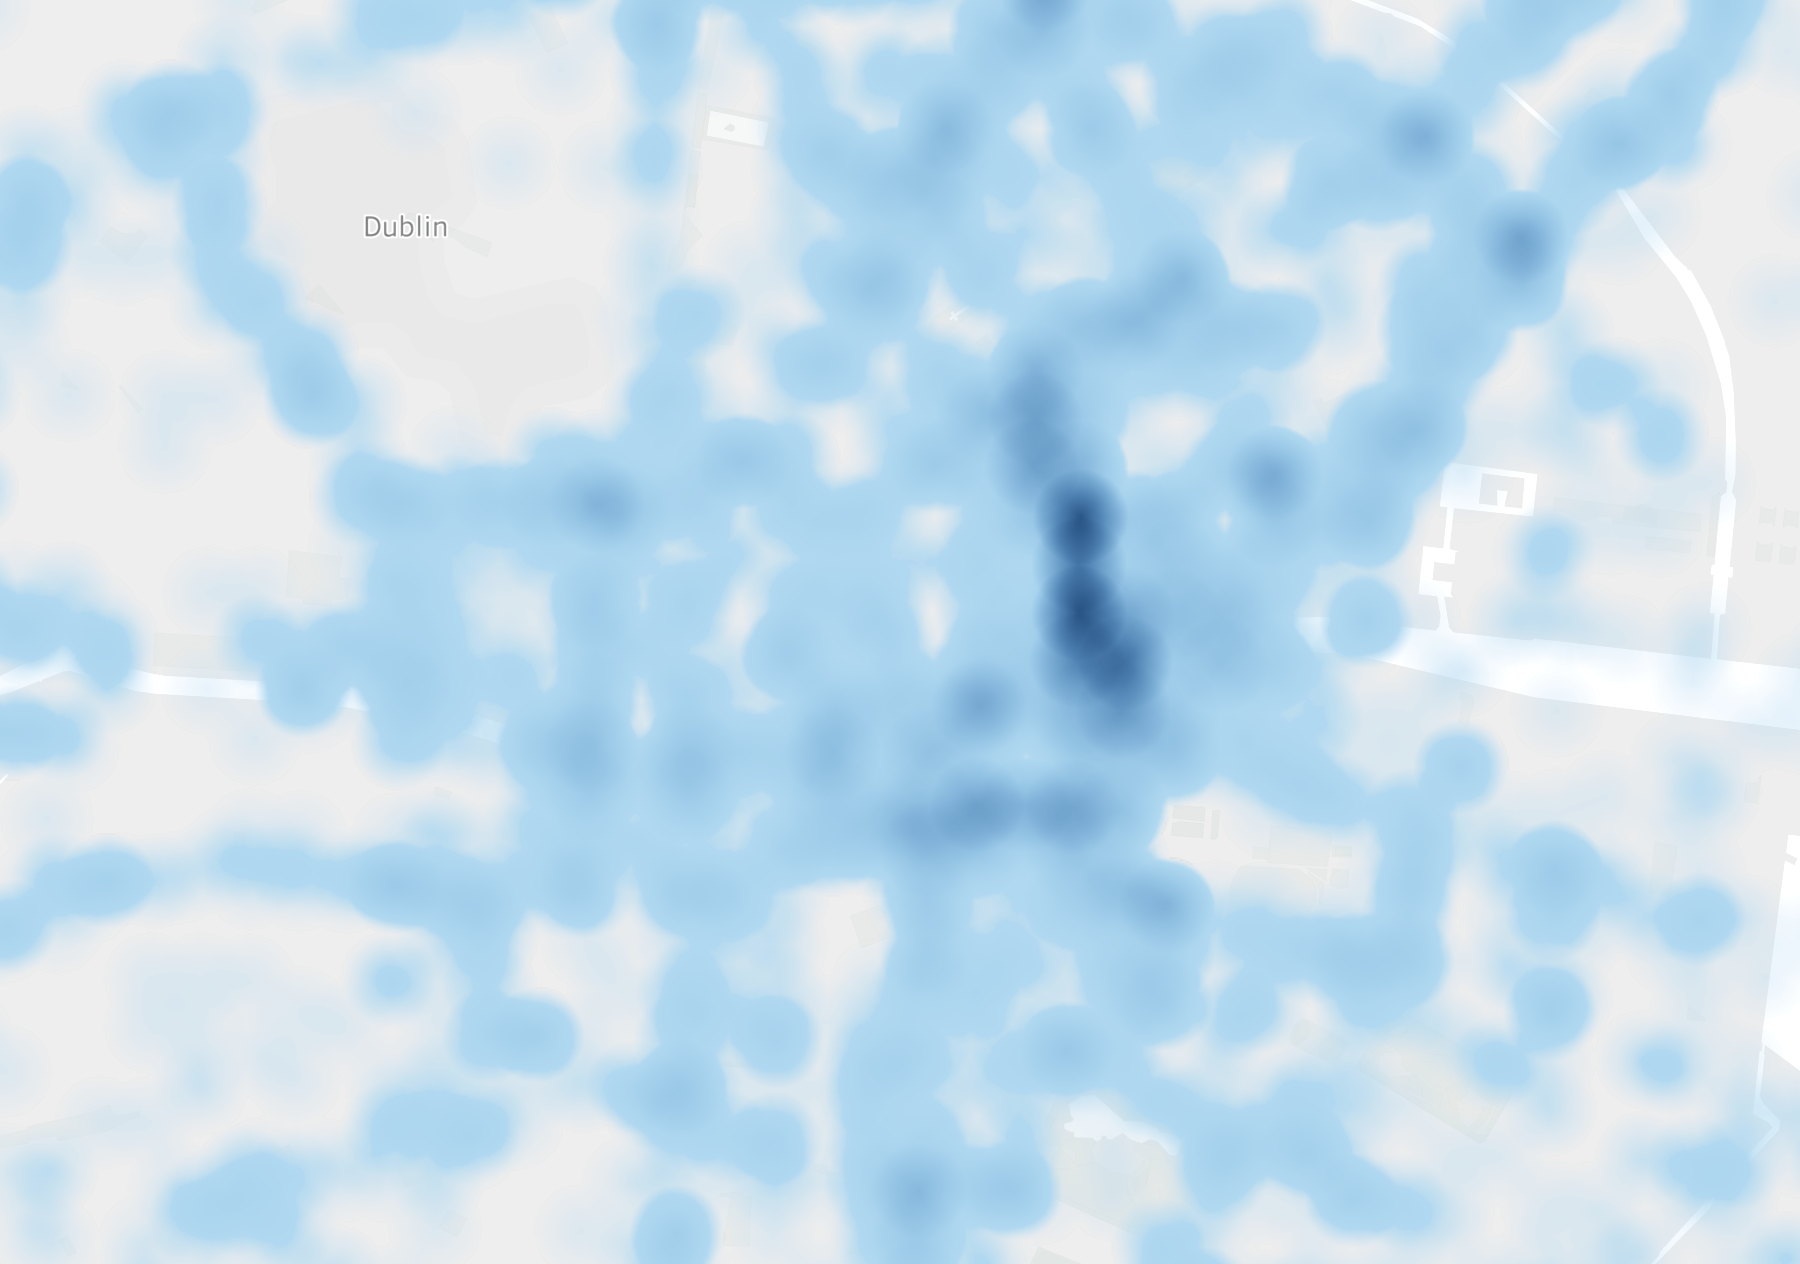 |
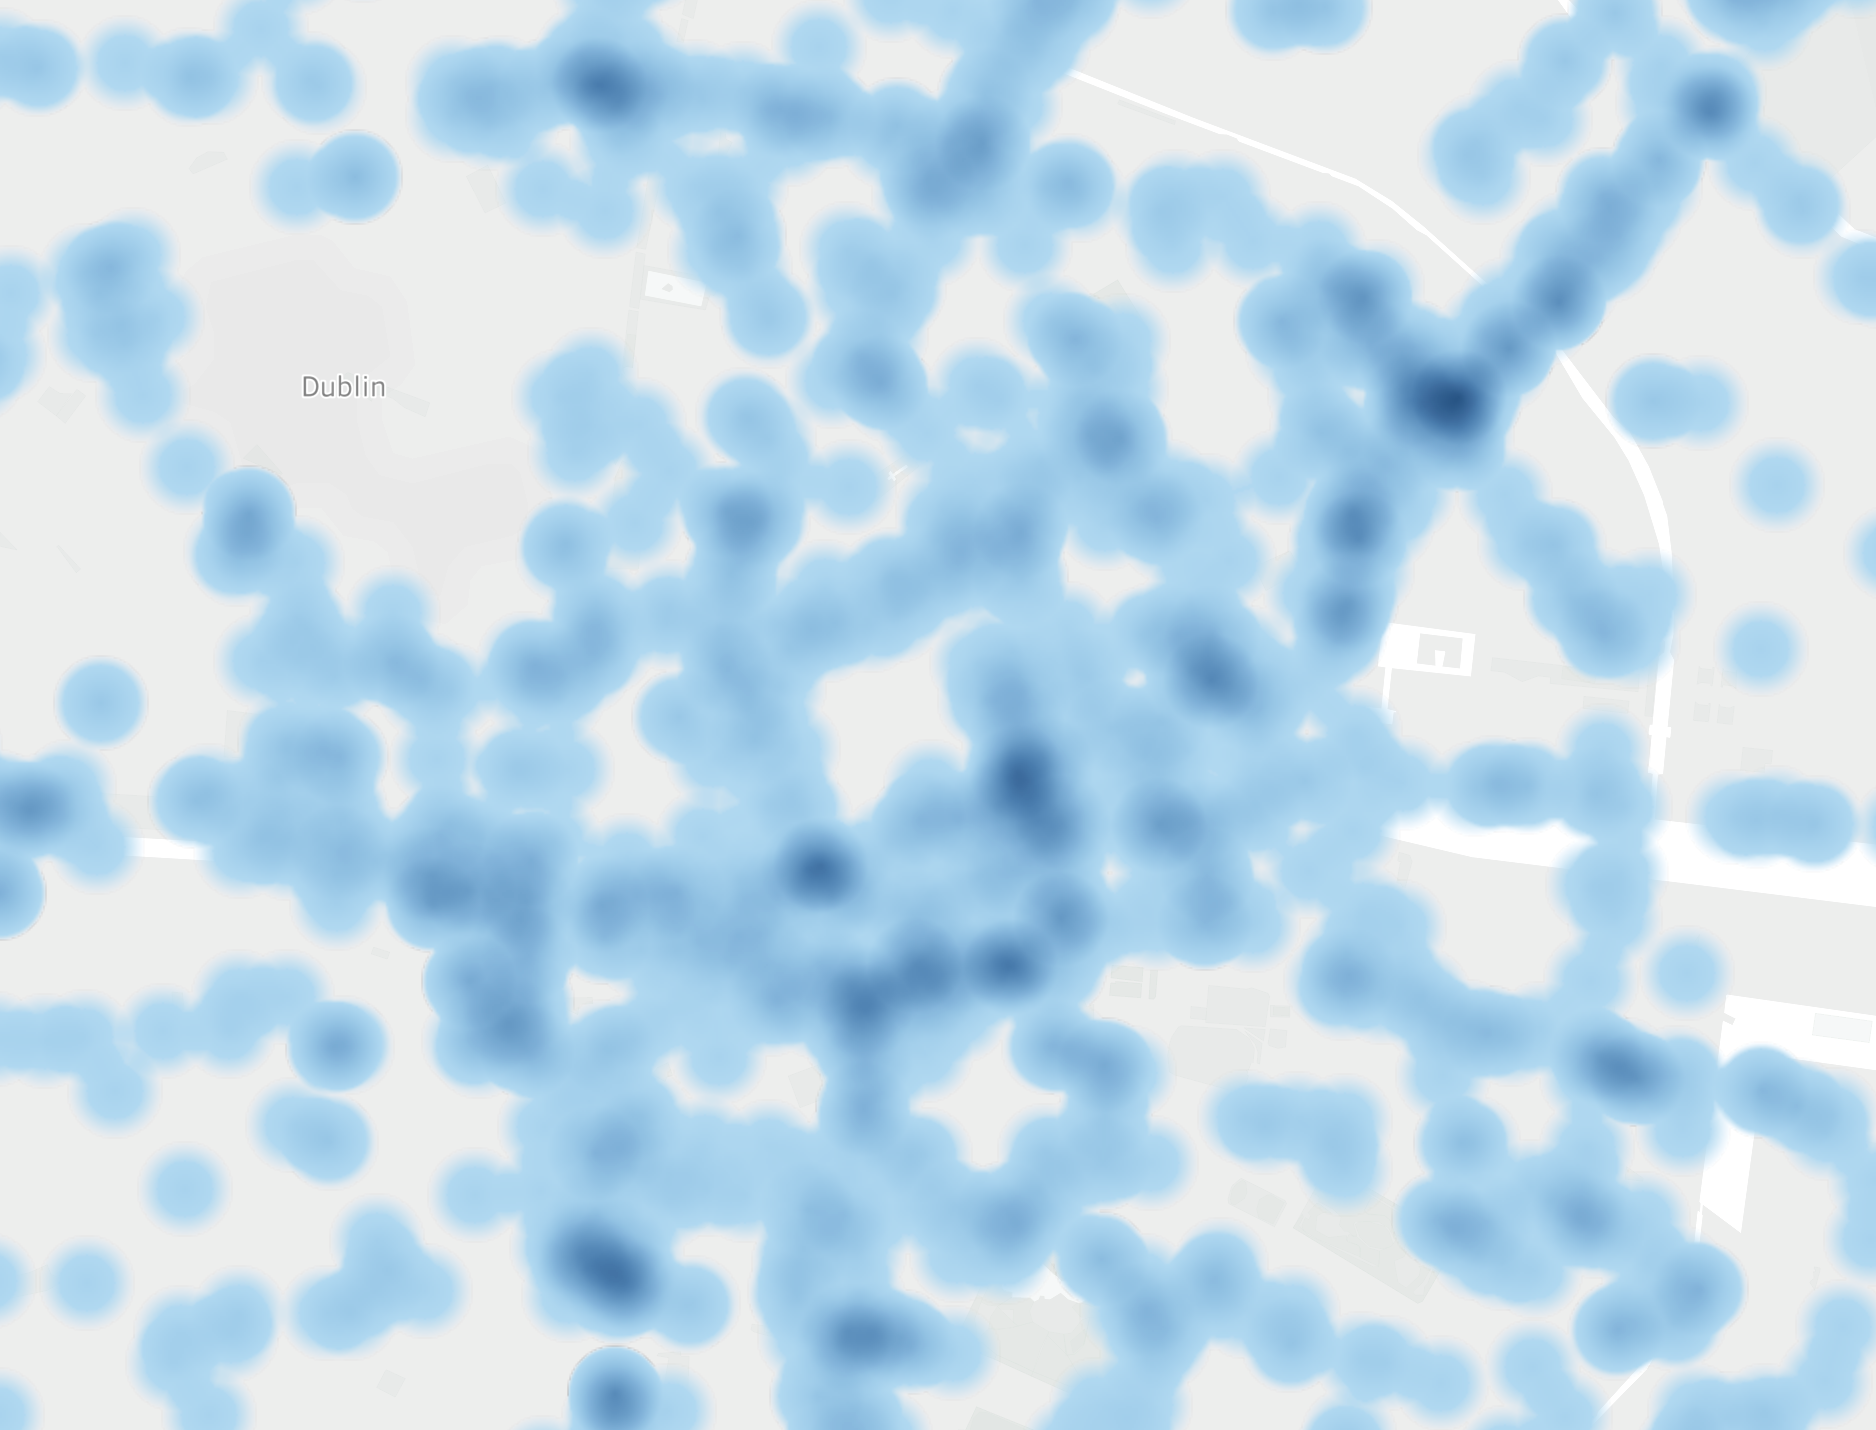 |
Figure 1: Density plot of Pedestrian (left) and Cyclist (right) accidents in Dublin City Council area, 1990-2015.
The availability of open source ESRI shape files also allowed choropleth maps of accidents to be created. For example, Figure 2 is a small area shape file for DCC with percent of accidents encoded by colour.
A screenshot of the Open Data visualisation can be seen in Figure 3 which is a visualisation of DCC road traffic accidents from 1990-2015 (the latest year for which data is available from Road Safety Authority (RSA). The application was created using the open software R using a number of R libraries including the mapping package leaflet.
The interface is uncluttered and easy to navigate, allowing users to quickly pan through the city and investigate accident clusters. It is not necessary to have the application itself or the raw data as saving the project as an html file allows anyone with a browser to interact with the application. The application clusters accidents and the area that each cluster covers is shown by means of a blue polygon as shown in Figure 3.

Figure 2: Choropleth map by Dublin City Council small area,1990-2015
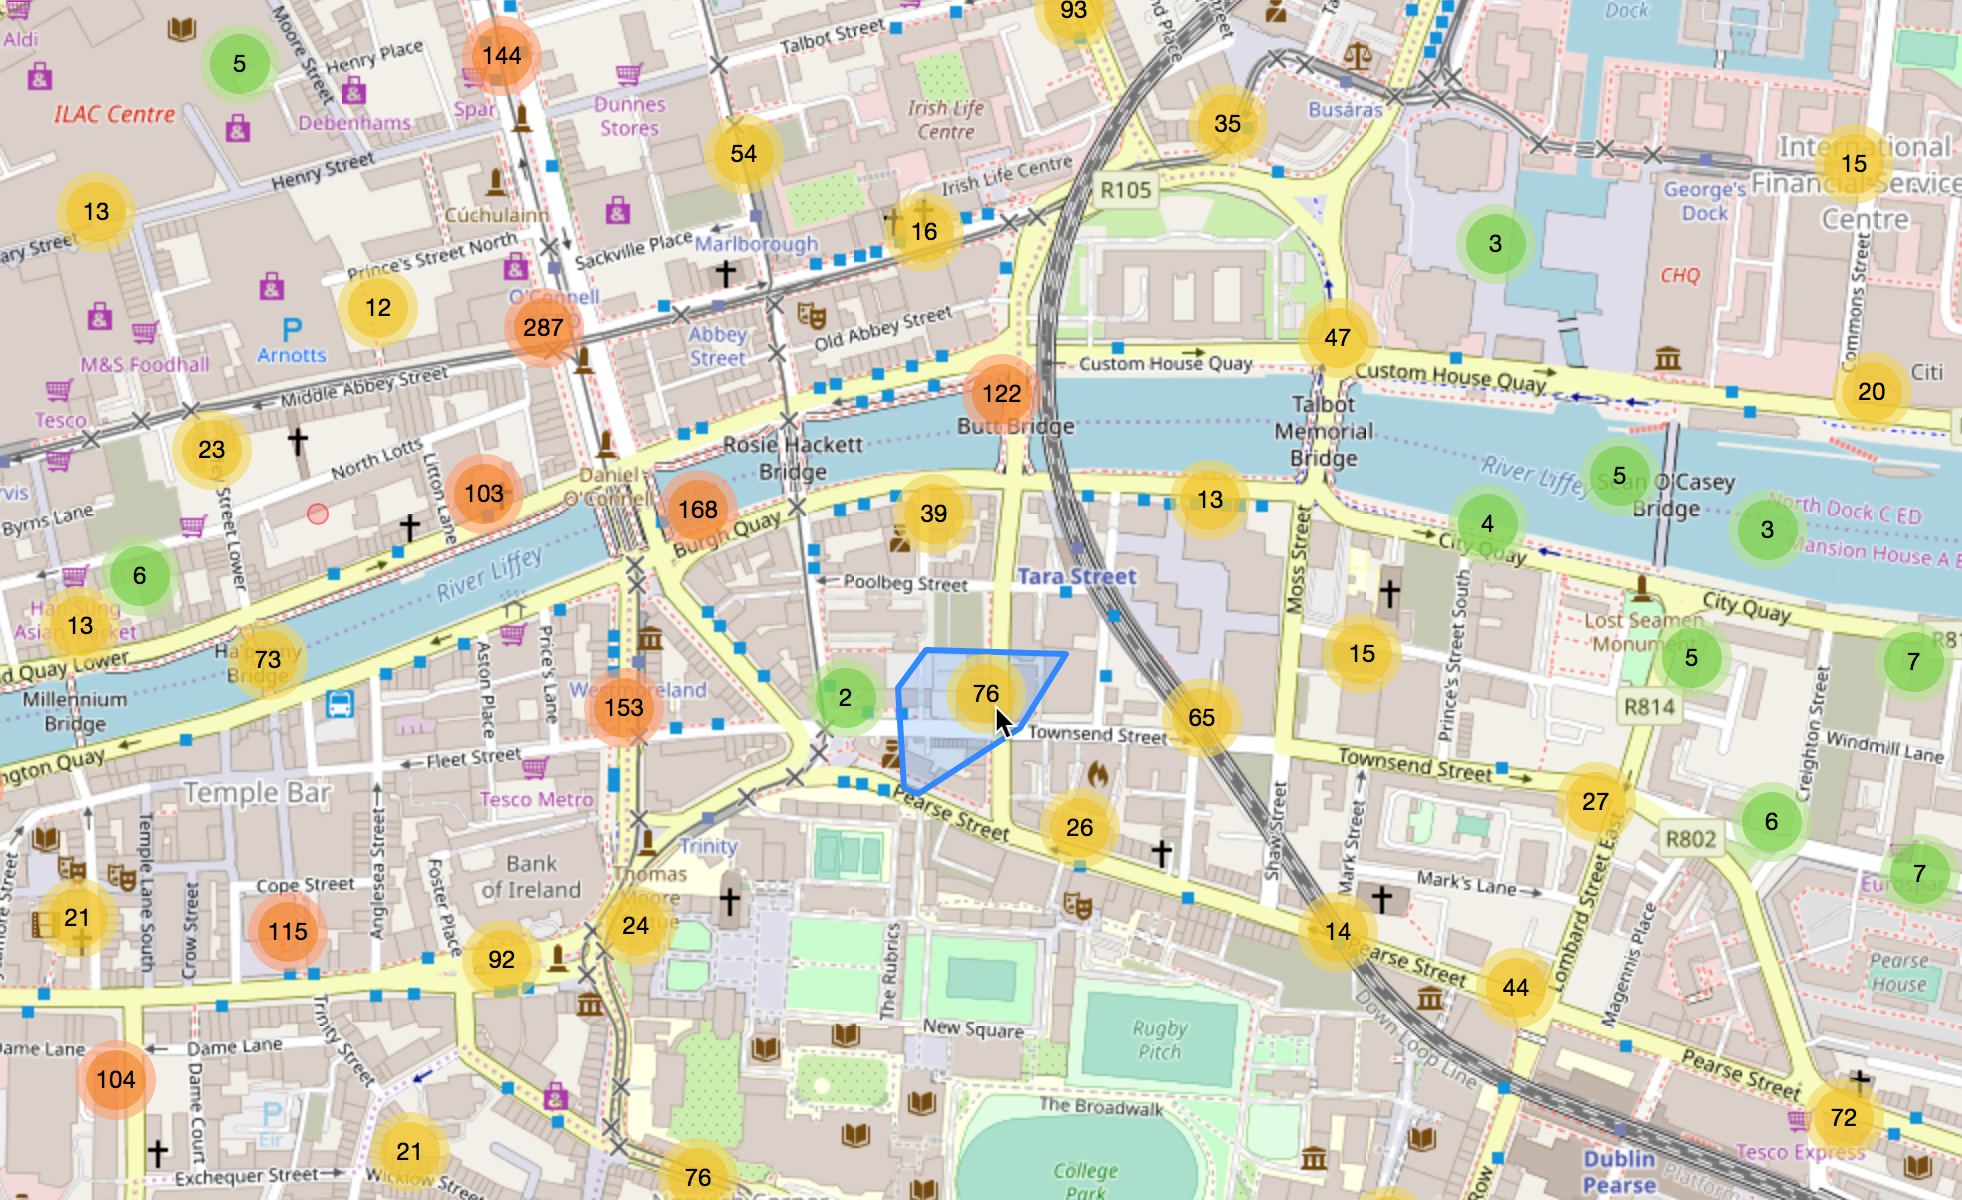
Figure 3: Visualisation of accidents using Open Street Map, 1990-2015
Zooming in, the clusters break down into smaller clusters until a single location marker remains. Clicking on this single marker brings up details associated with the accident e.g., the year it occurred and the accident type. If the location has several accidents with the same longitude/latitude the individual accidents will be shown in an expanded spiral layout as shown in Figure 4 for accidents on Marlborough Street.

Figure 4: Visualisation of overlapping accidents using Open Street Map, 1990-2015:
Note that overlapping accidents arose primarily during the 1990’s when the accident location was derived manually by reading ordnance survey maps with an accuracy of 100m2. GPS technology which has now become available to investigating gardaí provides for a high degree of accuracy in positioning accident locations.
The map interface gives a choice of two mapping tiles - the open street map tile shown in Figure 3 and Figure 4, and a tile known as Stamen Toner which is a high contrast black and white tile from the US firm Stamen in Figure 5. This tile provides a clear view of the accident locations without the additional features included in the open street tile like business names etc., and is my preference for navigating the map.
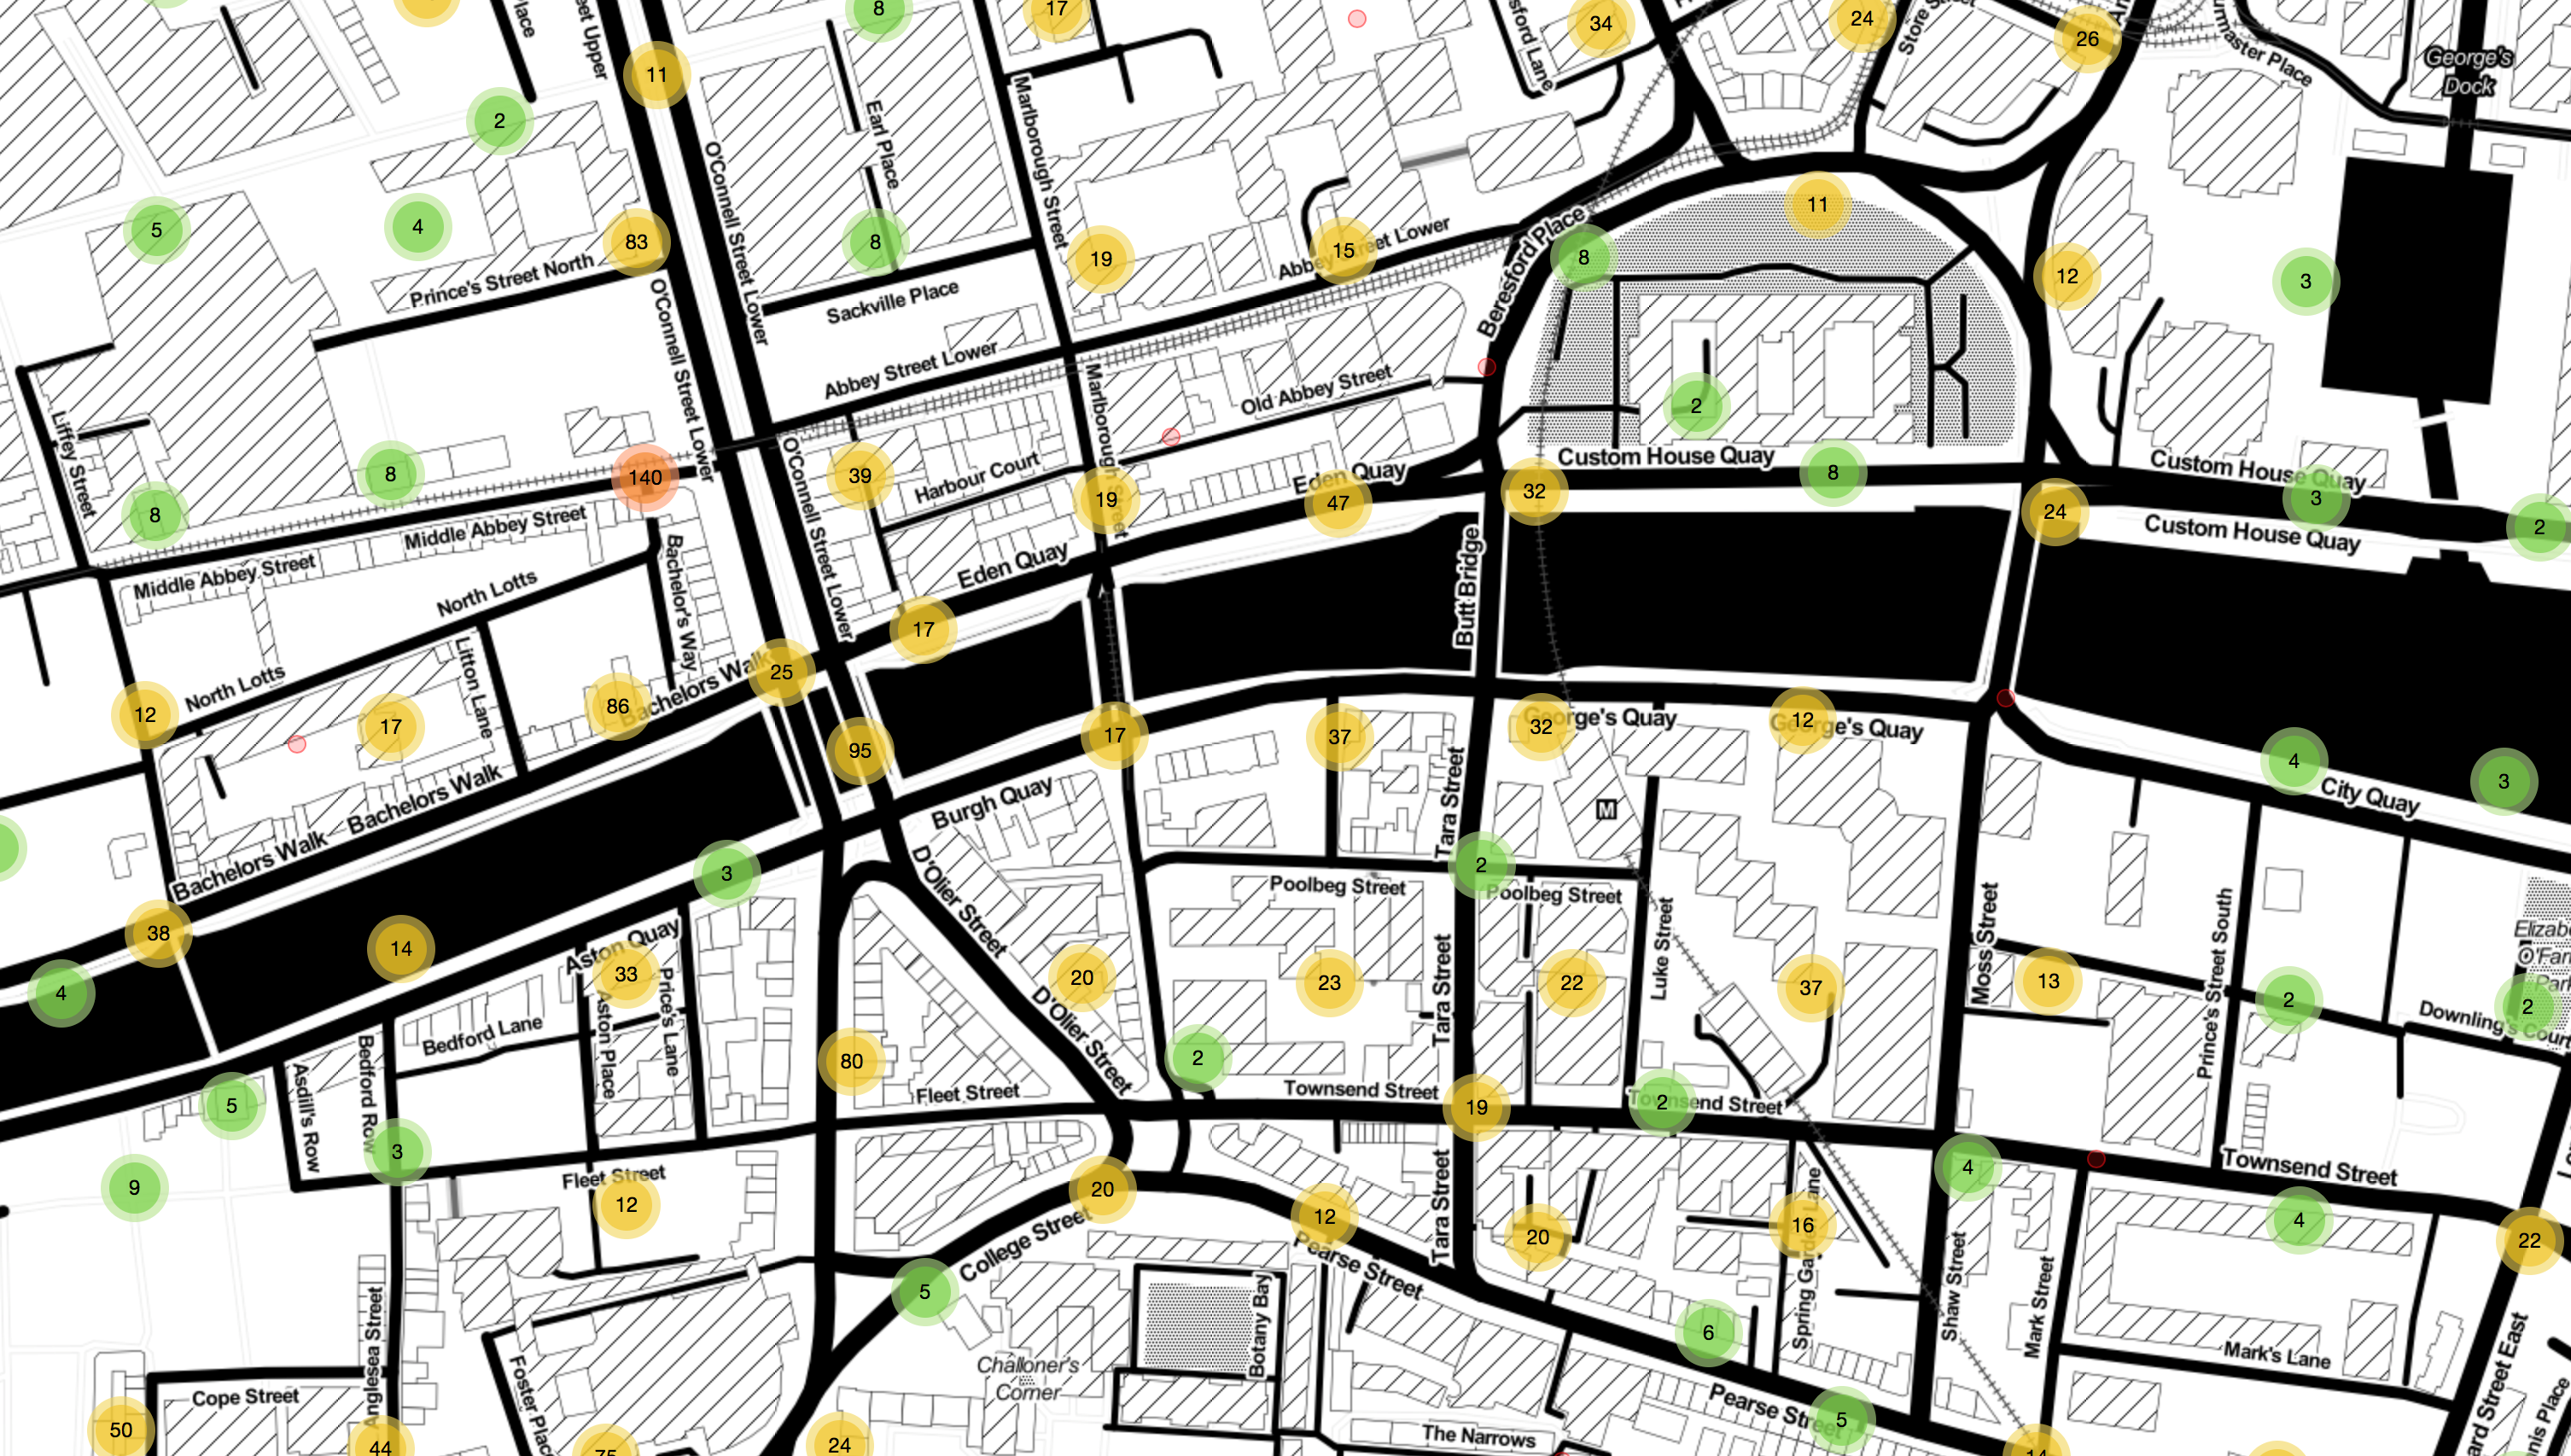
Figure 5: Visualisation of overlapping accidents using Stamen Toner Tile, 1990-2015:
A small area choropleth map in Figure 2 is included in the visualisation as an example of mapping accidents using shape files. These maps can now be created using spatial joins avoiding the need to have a specialised GIS application.
The interface also includes a filter that allows users to select all accidents or a particular type of accident e.g. pedestrian or cyclist. Filtering can assist in providing further insight into causal factors. Note that cyclist accidents are available from 1996 - 2015 as a change in the accident form, which came into effect in 1996, led to this road user having a more explicit category.
Creating the visualisation involved joining 26 road accident files which contain the records of accidents involving an injury that were reported to An Garda Síochaná (AGS) and subsequently recorded by AGS/RSA. Members of AGS either completed a paper form known as C(T)68 which was then entered into an RSA database or, in more recent years, by direct entry into the garda database Pulse.
There are a number of health warnings that the user should be alerted to before making any inferences about accident occurrence in DCC:
- The accidents are based on reported injury accidents to AGS that are subsequently recorded by AGS/RSA. Reporting and recording rates can vary significantly particularly for less serious accidents. Reporting and recording rates are also significantly impacted when major changes are introduced to the accident recording process e.g., a new form of technology being introduced. All fatal accidents however should be recorded and reported, but as we are examining urban accidents the number of fatal accidents is very small due to the low vehicular speed.
- The visualisation excludes accidents that do not involve a reported injury e.g. a material damage accident where a vehicle is damaged but no personal injuries are reported for any road user.
- The visualisation identifies locations with high accidents but not necessarily high risk locations as, for example, no mathematical/statistical modelling of pedestrian and/or vehicular flow rates are employed.
- In recent years about 1-2 per cent of accidents have no location recorded on the RSA file.
- The location of the accidents from 1990-2001 was found manually by reference to ordnance survey maps which had an error of 100m2. This means that older accidents may not have occurred at the indicated location indicated but within 100m2 of the recorded location.
Further work
This work could be extended to include other urban regions throughout the state and also prove useful for visualisation of rural accident locations. This visualisation is intended as an example of what can be done with geocoded data and be of use to a wide range of people/interests from researchers to the general public.
 Derilinx