Engagement Fund: Crimes at Garda Station Level and Pedestrian Footfall visualisations by Cyril Connolly, Institute of Art, Design and Technology, Dun Laoghaire.
23 Bealtaine 2017As the data visualisation pioneer John Tukey stated one of the great things about working as a statistician is that you get to play in everyone’s back yard! For the open data engagement fund I selected two back yards - crime and pedestrian footfall in Dublin.
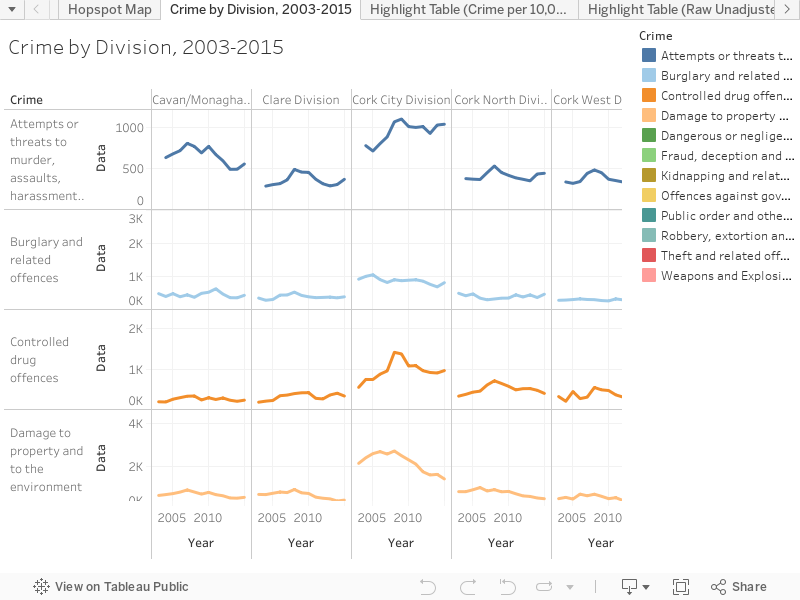
Visualisation of crime uses the data file Crimes at Garda Station Level which contains nine reported crime categories for each of the 563 Garda Stations in the Republic of Ireland from 2003 to 2015. The data set is published by All-Island Research Laboratory (AIRO) based on data obtained from the Central Statistics Office (CSO) and is hosted on the data.gov.ie site under the title Crimes at Garda Stations Level 2010-15[1]. Additional files used in the visualisation included CSO boundary files for Garda stations and population estimates for each Garda division.
The reason Crimes at Garda Station Level was chosen for the open data engagement fund application is because of the richness of the data set. The variables include 573 Garda stations with their associated geo-coordinates, 28 Garda divisions and 13 years of data for each of 12 crime categories. This offered a range of options for analysis and visualisation, including the use of polygon maps using ESRI shape files, hotspot maps and the use of trellis or facet plots for visualising categorical variables. The availability of data over time offered the opportunity to showcase some graphical ideas that are perhaps not that common, like Statistical Process Control (SPC) charts which can be used as a management tool to assess trends in crime. The availability of 12 crime categories meant that more advanced analytical methods could be employed to segment the 28 divisions into eight divisional areas which have similar crime patterns.
The outcome is the creation of interactive graphical visualisations to the level of Garda station which can allow for a fuller understanding of the distribution of crime in Ireland.
Click on "more by this author" to see a host of other visualisations of this data.
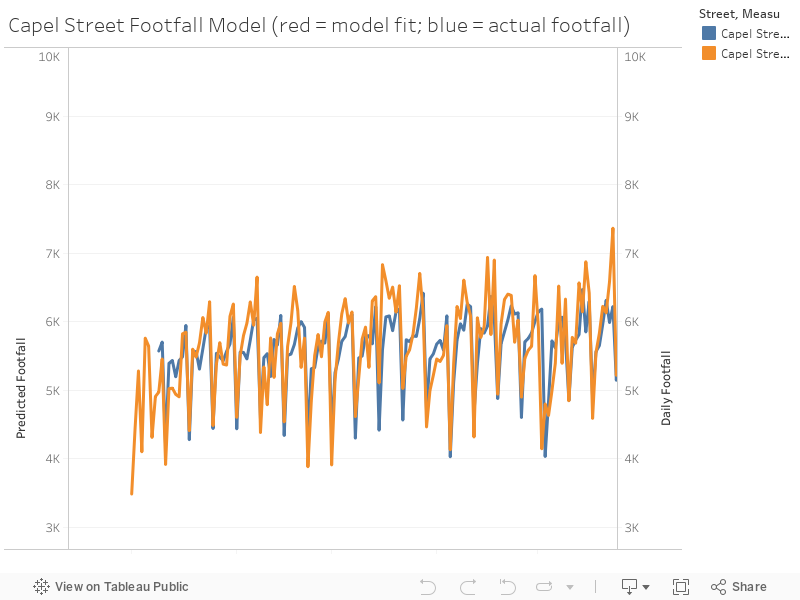
The second data set visualised is called Pedestrian Footfall which contains daily pedestrian footfall measured using cameras with high definition sensors positioned in four locations in Dublin City centre. The locations are Capel Street, Henry Street, Mary Street and O’Connell Street. For each day of 2015 the daily footfall for each of the four locations is provided in a csv file. The data is published by Dublin City Council and is hosted on the data.gov.ie site under the title Pedestrian Footfall. This data is a subset of a larger file containing footfall for 13 locations in Dublin City Centre which was collected by the Dublin Business City Improvement District organisation (now called We Are Dublin Town, http://www.wearedublintown.ie which contains data from 2003-2015)).
This data set was selected for two reasons. The amount of pedestrian footfall can be used as an indicator of general pedestrian activity. This in turn may be used to explain the importance of this indicator on levels of pedestrian accidents. The second reason is to showcase the use of time series intervention analysis as a useful tool to determine the impact of holidays and other events throughout the year e.g. October bank holiday on footfall levels.
The outcome of this exploratory work is that pedestrian footfall does not seem to vary significantly throughout the year in these locations while a time series intervention model developed for the Capel Street provides estimates of the effects of holidays and other events in 2015 on footfall.
Further details of the project are available here.
Pedestrian Footfall Report
Crime Data
 Derilinx