Engagement Fund: Objective Quality of Life Index based on Open Data - Brian O'Mullane - Creme Software
17 July 2017Overview
Often standard of living is emphasised over quality of life, in part due to the fact that it is easier to measure, whereas quality of life gives the better measure of the success of society. With the resolution of the quality of life measures based at a community level, a better understanding of what initiatives and environment are working to improve people's lives can be understood.
This project uses data from the open data portal (data.gov.ie) to put quality of life scores on a locational basis in Ireland. To make the data comparable to other measures, the public formula from Numbeo was used. The input data to Numbeo’s database is generally subjective survey, whereas a goal of this study was to use objective measures so it could be rerun and see the effect of changes. To achieve this goal it was first necessary to create a mapping between the measures of Numbeo and the data available on the open data portal (https://data.gov.ie).
Method
The formula
The formula used by numbeo (https://www.numbeo.com) is defined as follows:
index.main = Math.max(0, 100 + purchasingPowerInclRentIndex / 2.5 - (housePriceToIncomeRatio * 1.0) - costOfLivingIndex / 5 + safetyIndex / 2.0 + healthIndex / 2.5 - trafficTimeIndex / 2.0 - pollutionIndex * 2.0 / 3.0 + climateIndex / 2.0);
Which shows a weighted summation of a several factors that influence the quality of life:
- purchasingPowerInclRentIndex
- housePriceToIncomeRatio
- costOfLivingIndex
- safetyIndex
- healthIndex
- trafficTimeIndex
- pollutionIndex
- climateIndex
Data preparation
The data preparation phase was the largest part of the exercise. To find the data that best matched the measured needed, extract them to a common format and harmonise them across all datasets. The most common geographical unit that was available was county level, so this was used as the main variable. Data for some of the factors could only be found at a state level, where this was the case the same value was used for every county.
The following mapping and process was used for each required data variable.
PurchasingPowerInclRentIndex: We use the database with information about Purchasing Power (Euro) by State and Year (CPA05). We read it directly from the json url provided by CSO. This method allow us to update our results always with the last data offered by the government, because we use the last data in the json. In this case we only have data for whole State, we extracted this and used it for each county. Comparing this to Numbeos subjective measure we generated an mapping factor of 1.65 to make our results comparably internationally. When we have data from more years we can see if this mapping is really a fit or it necessary to adjust it. |
|
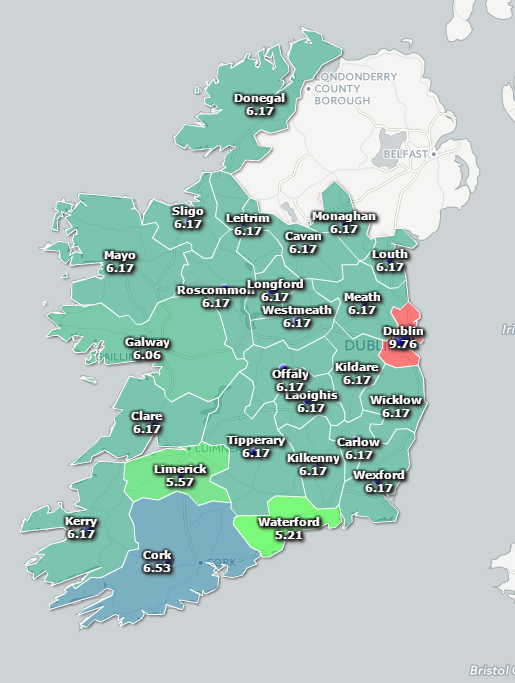
HousepriceToIncomeRatioIndex: The Average Price of Houses in each county was used from the database HSA06 (Average Price of Houses by Area, Year and Statistic). This json didn’t have information for all counties, where counties data was not available an average of it’s neighbouring counties and the other areas was used. Using the average earning JSON from the database EHA05 (Average Annual Earnings and Other Labour Costs by Type of Employment, NACE Rev 2 Economic Sector, Year and Statistic). We used data from the most recent year. As we only have data for State, we extract it and asing the same number for each county. With these two numbers we created an index for house price to income for each county. Which highlighted Dublin as the lowest.
|
|
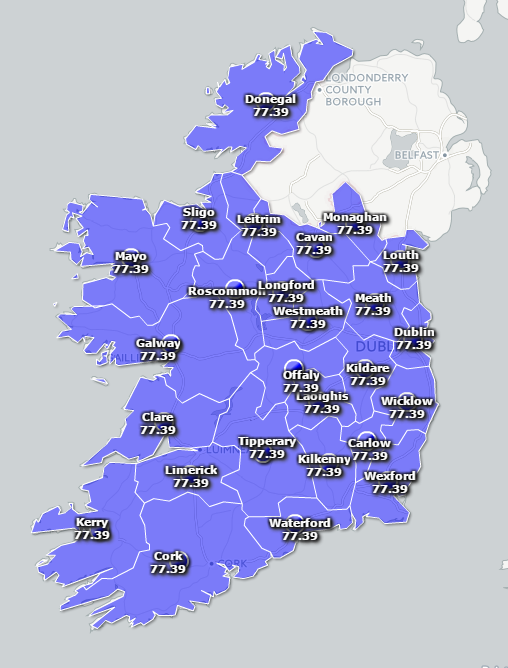
CostOfLivingIndex: The cost of living index data was taken directly from numbeos data set as there were no suitable data sets available in the open data set. Numbeo only provided data for three specific areas, for all other areas we used the numbeos data for the state.
|
|
SafetyIndex: The safety index is calculated from the crimeOffences database CJA07, Recorded Crime Offences by Garda Station, Type of Offence and Year . The data is divided by the number of garda, then we group it for counties. After this we need the population and we read it from the database CD101, Actual and Percentage Change in Population by Sex, Aggregate Town or Rural Area, Province County or City, Census Year and Statistic. This database only has data for the census years 2006 and 2011. We used the data from 2011, but when more current data becomes available rerunning the provided scripts will give an updated result. The final score is scaled to match Numbeos. This was done by using numbeos scores for three counties and scaling with a linear correlation to the corresponding points in our objective measures. |
|
HealthIndex: The health index is calcuated from healthCareExpenditure database, SHA07 (Revised Health Care Expenditure by State, Year and Statistic ). The script pulls this information direct from the provide URL and process the data, so it can be rerun at a future date. The script normalises it across all counties and county populations. It then compares it to Numbeos data to put it in the same scale. A linear representaion was used with a slope = 11.4 and intercept = -25.53, after log transforming healthCareExpenditure. |
|
TrafficTimeIndex: We used the total time travelling from the database CD005 (Population by Sex, County of Usual Residence, Travelling Time, At Work School or College and CensusYear). From this we obtain a number for each county. Then we divided this total time for a county by the population of that county and to obtain the final score we multiply it by our travelling/population score. Then finally to make it comparable to Numbeos measures we compared the calculated scores to Numbeos using a linear correlation and calculated an adjustment value. This adjustment value is stored in a .txt file with the scripts for reuse. |
|
PollutionIndex: We read the Air Quality Index from the url of the json maintained by the EPA. We obtain a number for six general areas (Rural_East, Cork_City, Rural_West, Large_Towns, Small_Towns and Dublin_City). With this data we approximated a calculation for each county to obtain the final index. |
|
ClimateIndex: We used the average temperature from database MTM02 (Temperature by Meteorological Weather Station, Month and Statistic) taken in all the Weather Stations. County temperatures were calculated from this, by finding the nearest weather station to each county and scaled it to fit on the 0-100 range. For rainy day data we used the database MTM01 (Rainfall by Meteorological Weather Station, Month and Statistic) and calculate the difference between the best possible (half of days in a year rainy and half sunny) and scaled it to be between 0 and 100. We did the same for the Sunny days using the database MTM03 (Sunshine by Meteorological Weather Station, Month and Statistic). Finally, we averaged all 3 indexes to create the climateIndex. |
|
.png)


Coding the formula
With this data in place we wrote a script that generates the QualityOfLifeIndex for each county in Ireland with a similar formula to Numbeo. In our case:
qualityOfLifeIndex = 100 + purchasingPowerInclRentIndex / 2.5 - (housepriceToIncomeRatio * 1.0) - costOfLivingIndex / 5 + safetyIndex / 2.0 + healthIndex / 2.5 - trafficTimeIndex / 2.0 - pollutionIndex * 2.0 / 3.0 + climateIndex / 2.0
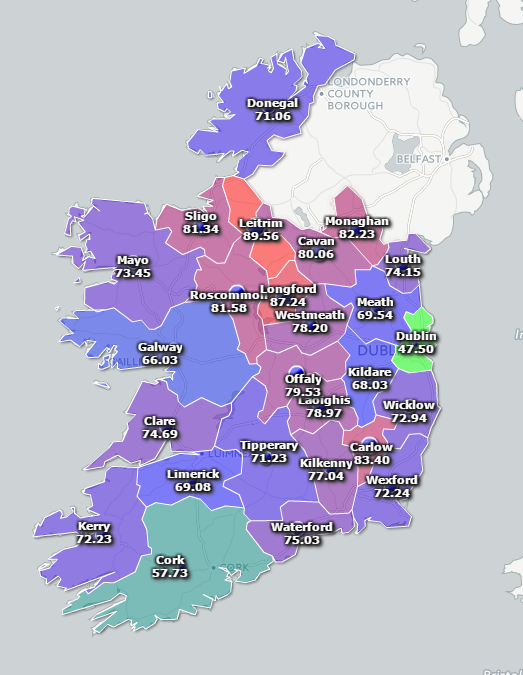
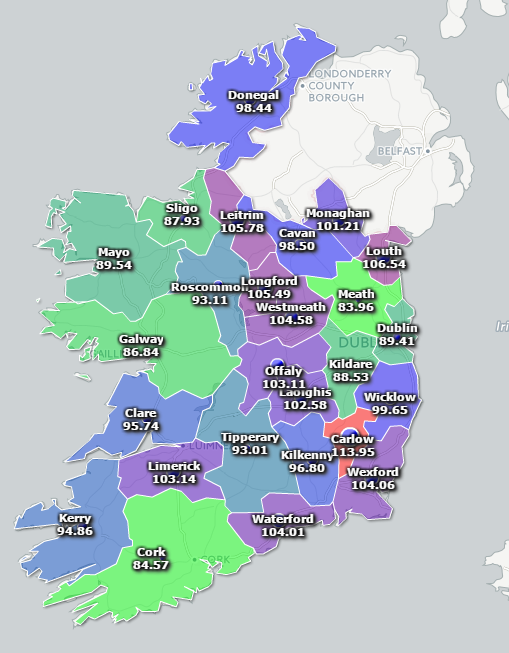
The generated results are shown on the following map:
Conclusions
It is hard to make direct comparisons between the individual objective county measures and the subjective international scores on Numbeo as one person’s rating for “good” weather may be very different to another's. But these objective measures do give a good basis for calculating or seeing the temporal change in scores over time, they also serve as a good basis for inter county comparisons.
This study shows that the highest scores for quality of life, as in the best place to live, is in Carlow. Carlow benefits from having one of the highest health spend per capita in the country and one of the highest score in the safety index.
The lowest scores are in Meath, which scored poorly for the safety index and also has one of the worst traffic Time Index, which may be related to having a large population that commute to Dublin for work.
Resources
Following the open data idea, the code used for this application is also free for download for consultation and/or modification. The repository is here:
https://stash.cremelabs.com/projects/OD/repos/quality-of-life-index/browse
Also we create an interactive map everybody can consult here:
http://www.targetmap.com/viewer.aspx?reportId=53031
Brian O'Mullane, Creme Software
 Derilinx