Exploring the Impact of the 2008 Financial Crisis Through Birth Rate & Disposable Income Data
By Justin Perry Doyle
A collaboration between the Central Statistics Office (CSO) and University College Dublin (UCD) invited students to explore High Value Datasets (HVDs) and develop interactive visualisations demonstrating their real‑world application.
Five standout projects were shortlisted and presented at a showcase event in the CSO, highlighting the value of visualisation in unlocking the power of HVDs - datasets identified for their significant potential to bring about economic and social benefit.
The initiative was highly successful, demonstrating how open data, particularly HVDs, can drive insight, support innovation, and enhance transparency and evidence-informed decision-making across academia, policymaking, and civil society contexts.
If you'd like to learn more about the initiative, check out our blog post here
Insights are based on data made available by the Central Statistics Office (CSO) but the CSO and data.gov.ie does not take any responsibility for the views expressed or the outputs generated.
This impact story highlights one of the student projects from that showcase.
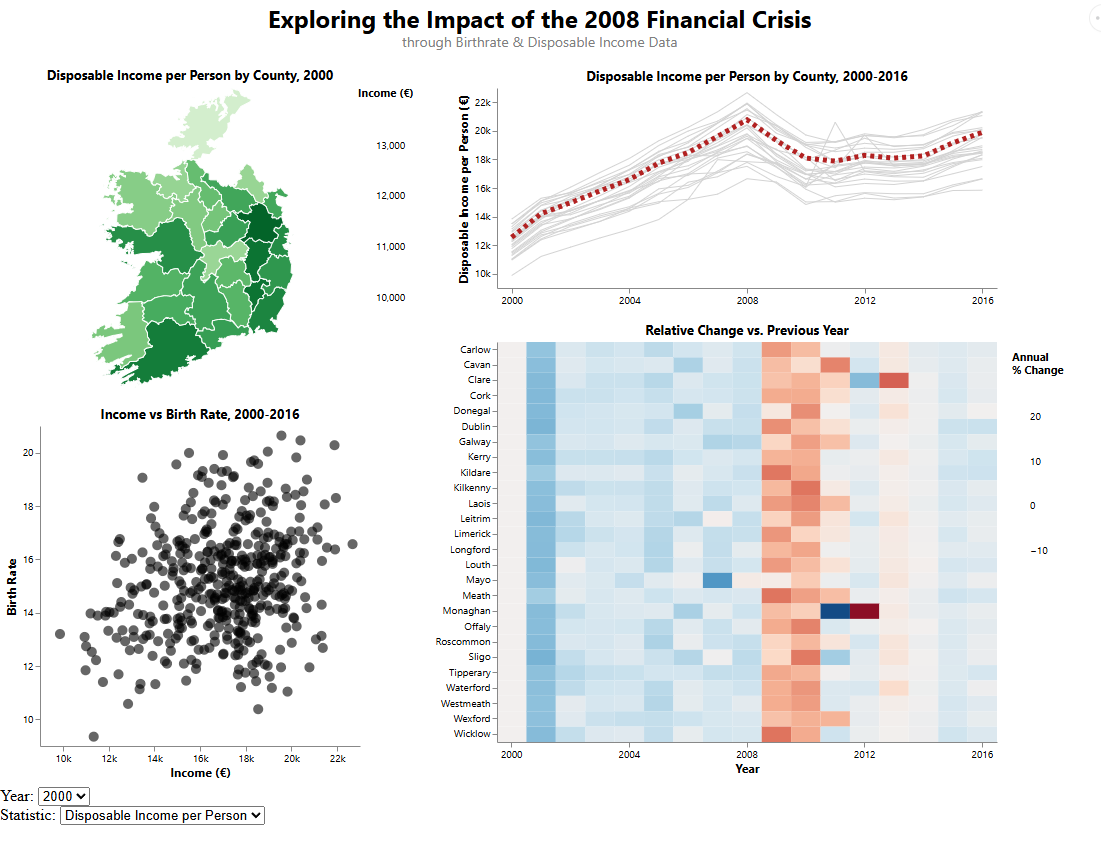
The original idea for the plots began while researching a design assignment during my master's, and exploring the CSO's High Value Datasets (HVDs) and wider open data catalogue. When looking at the Births by County of Residence of Mother (DHA09) dataset, I noticed a decline in and around the 2008 financial crisis, which drew me to the topic and allowed the data to guide the analysis rather than starting with a preconceived idea. I also wanted to contrast this dataset with something that would be affected by a major financial crisis, which led me to the Disposable Income (Euros) – RAA02 dataset. Once the datasets were gathered, visualisations such as line plots and choropleth maps were natural choices, alongside features allowing users to select county, year, and dataset within the dashboard. The datasets cover the period from 2000 to 2016 inclusive. My lecturer, Dr Anh Vu Vo, recommended the inclusion of a lasagna plot, which plays an important role in showing how counties were impacted using colour, making the information easier to interpret and supporting further exploration. A dot plot was also included to examine how the datasets relate to each other, although they do not appear to show a strong relationship. Being selected to present this work at the CSO was an incredible honour and a highlight of my year.


 Derilinx