How To View Dashboard as a Public User?
Creation Date: Sep 30, 2025
Created By: Derilinx Team
1. Type a search term related to the dataset. For example - temperature.

2. Click on Search icon

3. Dataset related to the search term will be displayed

4. Dashboard for the dataset will be displayed

5. Click on Filters
Use filters option to refine the results. The results will be refined for the entire dashboard. To refine results per chart, filter must be applied for each chart.

6. Scroll down to view each chart on the dashboard

7. Click on the title of each chart to view charts in detail and/or refine results
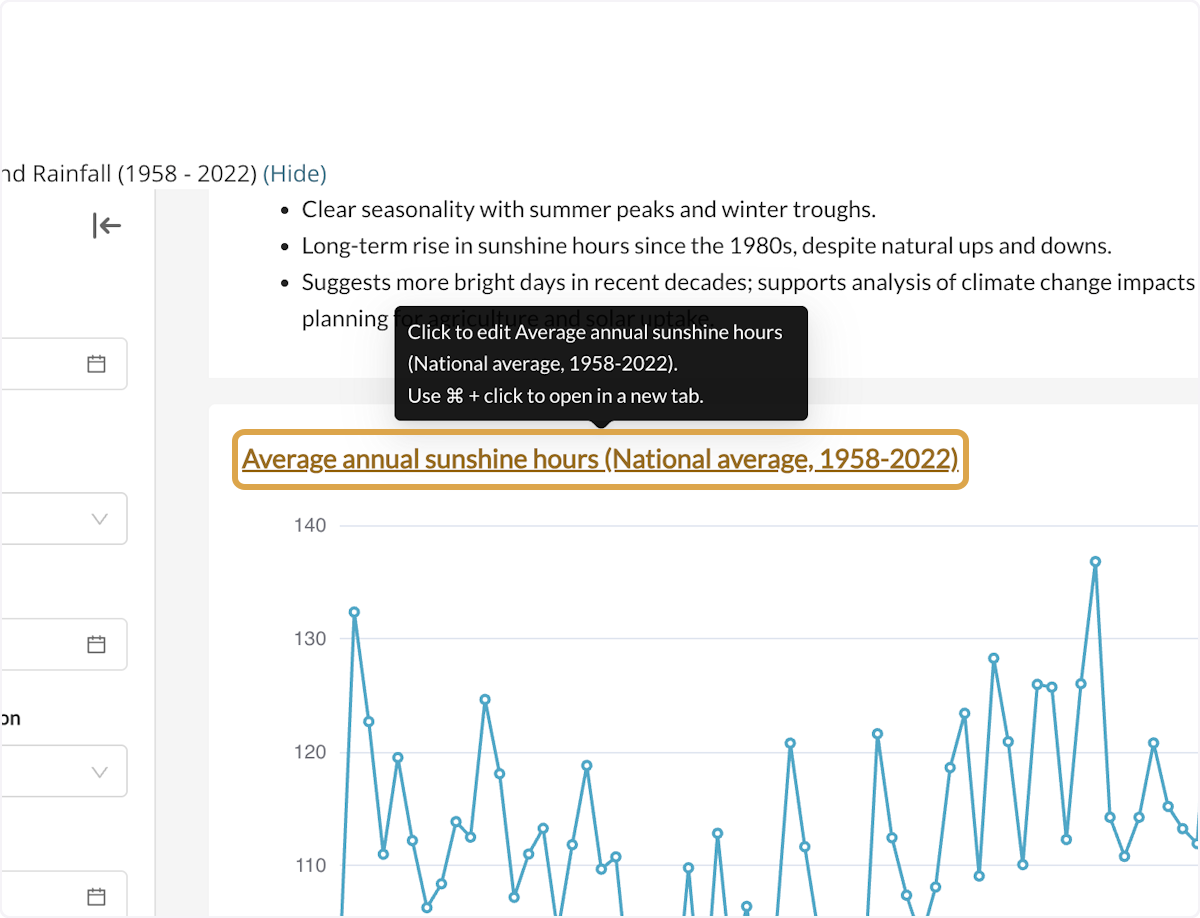
8. Click on Data to apply filters and refine results.

9. Click on Update chart
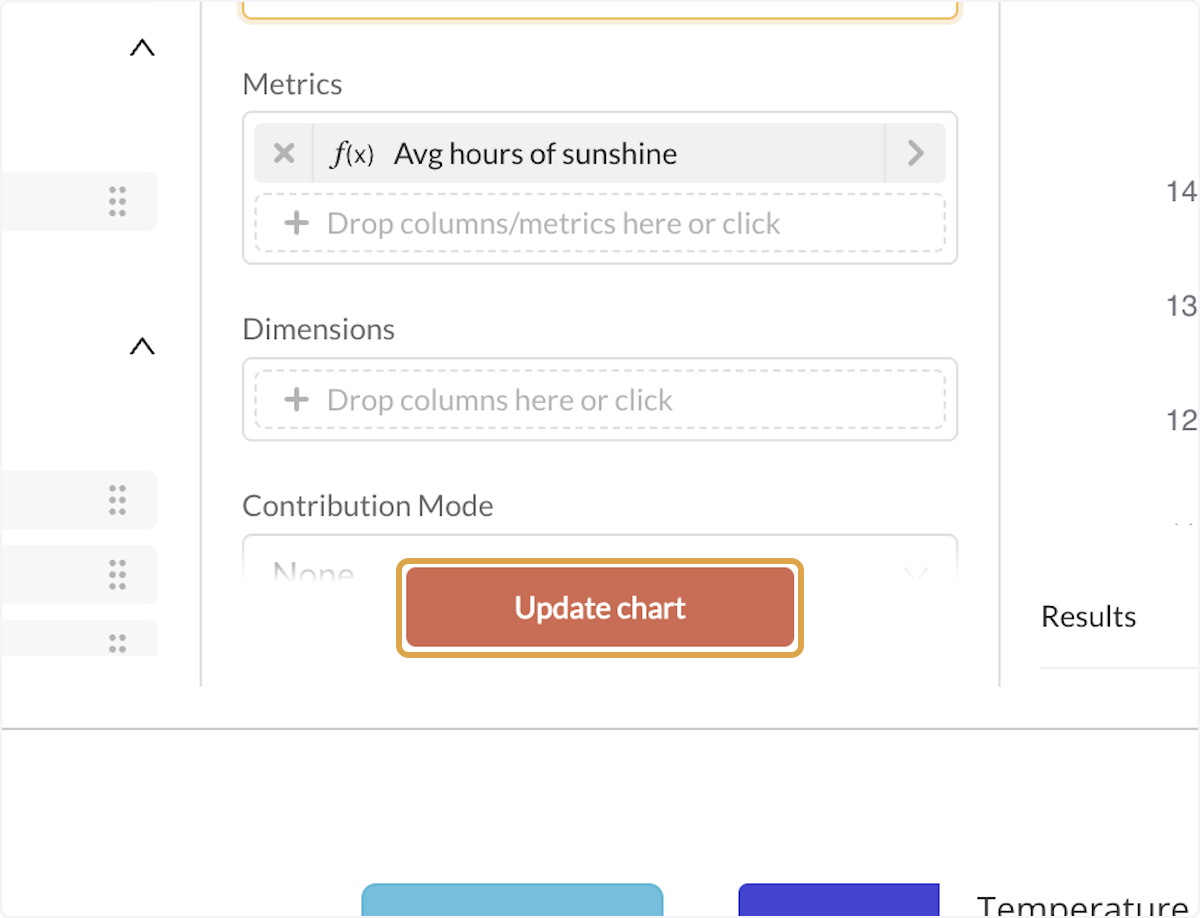
10. Chart will be updated

11. Click on Menu actions trigger for more options

12. Click on Download to download the chart in various file types

13. Click on View query

14. Click on View query...


 Derilinx